Drawing from 10 years of working on a variety of startups, there’s a simple spreadsheet that is effective for gaining clarity on the B2B SaaS go-to-market motion. I’ve found that most early-stage CEOs (even some series A companies) are missing any version of this seemingly basic tracking method.
A clear understanding of the go-to-market motion is crucial to successfully navigating the complexities of building a successful B2B SaaS.
Building a successful and sustainable business is often a daunting task for most B2B SaaS founders and senior leadership teams. It is especially difficult when they must also navigate the intricacies of building efficient SaaS teams without the benefit of previous experience in those areas.
This leads to many product-oriented founders and inexperienced B2B SaaS leaders struggling to determine the effectiveness of their sales and marketing strategies.
The struggles often manifest in the following ways:
- a lack of knowledge about who to hire for leadership roles in sales and marketing
- uncertainty about what to expect from these leaders
- and a lack of understanding about what constitutes good or bad performance in these areas.
One of the solutions involves having clarity on the conversion rates at each stage of the sales and marketing process. Tracking these numbers consistently provides valuable insight and helps to inform decision-making.
Proactive tracking of the flow of prospects from the go-to-market activity allows leadership teams to understand available levers. And this helps determine where to invest and where to cut back on often scarce resources.
Tracking these rates at different points on the marketing-sales funnel in a spreadsheet can provide valuable insights to inform data-driven business decisions. While it may take some effort to set up initially, the daily maintenance required to keep it updated is minimal and the benefits it provides are well worth the effort.
Purchase and download the complete template here.
A spreadsheet like this one is a great tool for tracking both inbound and outbound channels. Of course, the lead-to-customer funnel stages would need to be tailored to specific use cases. To examine the insights that can be gleaned from this data, let’s break down the various parts of the funnel.
Purchase and download the complete template here.
Visitors to Contacts CR%
Clarity on how many visitors turn to contacts allows you to understand if the marketing efforts are moving visitors to your website deeper down the funnel.
A dropping conversion rate may indicate that:
- The promise made at the source of the traffic was not delivered on the landing page e.g.: your google ad copy was good enough for the prospect to click on but the landing page was not compelling enough for the prospect to provide their contact information
- And/or the prospects did not match the ideal customer profile (ICP) for your product e.g.: One or more marketing campaigns are targeting the wrong audience
- And/or the website needs to be optimized for contact information: e.g.: Progressive profiling so the prospect is not asked for too much information at once
- Etc.
Visitor to MQL CR%
Watching this metric can help to assess general top-of-funnel trends of the GTM motion. Too much variation in the trend indicates an underlying problem that increases pipeline unpredictability like
- Targeting the wrong ICP (Ideal Customer Profile). You need to ensure that your sales-marketing efforts are aligned and a keen understanding of your ICP is a good place to start at.
- More nurture is needed to lead top-of-funnel prospects further down.
- Etc.
Aim for incremental improvements.
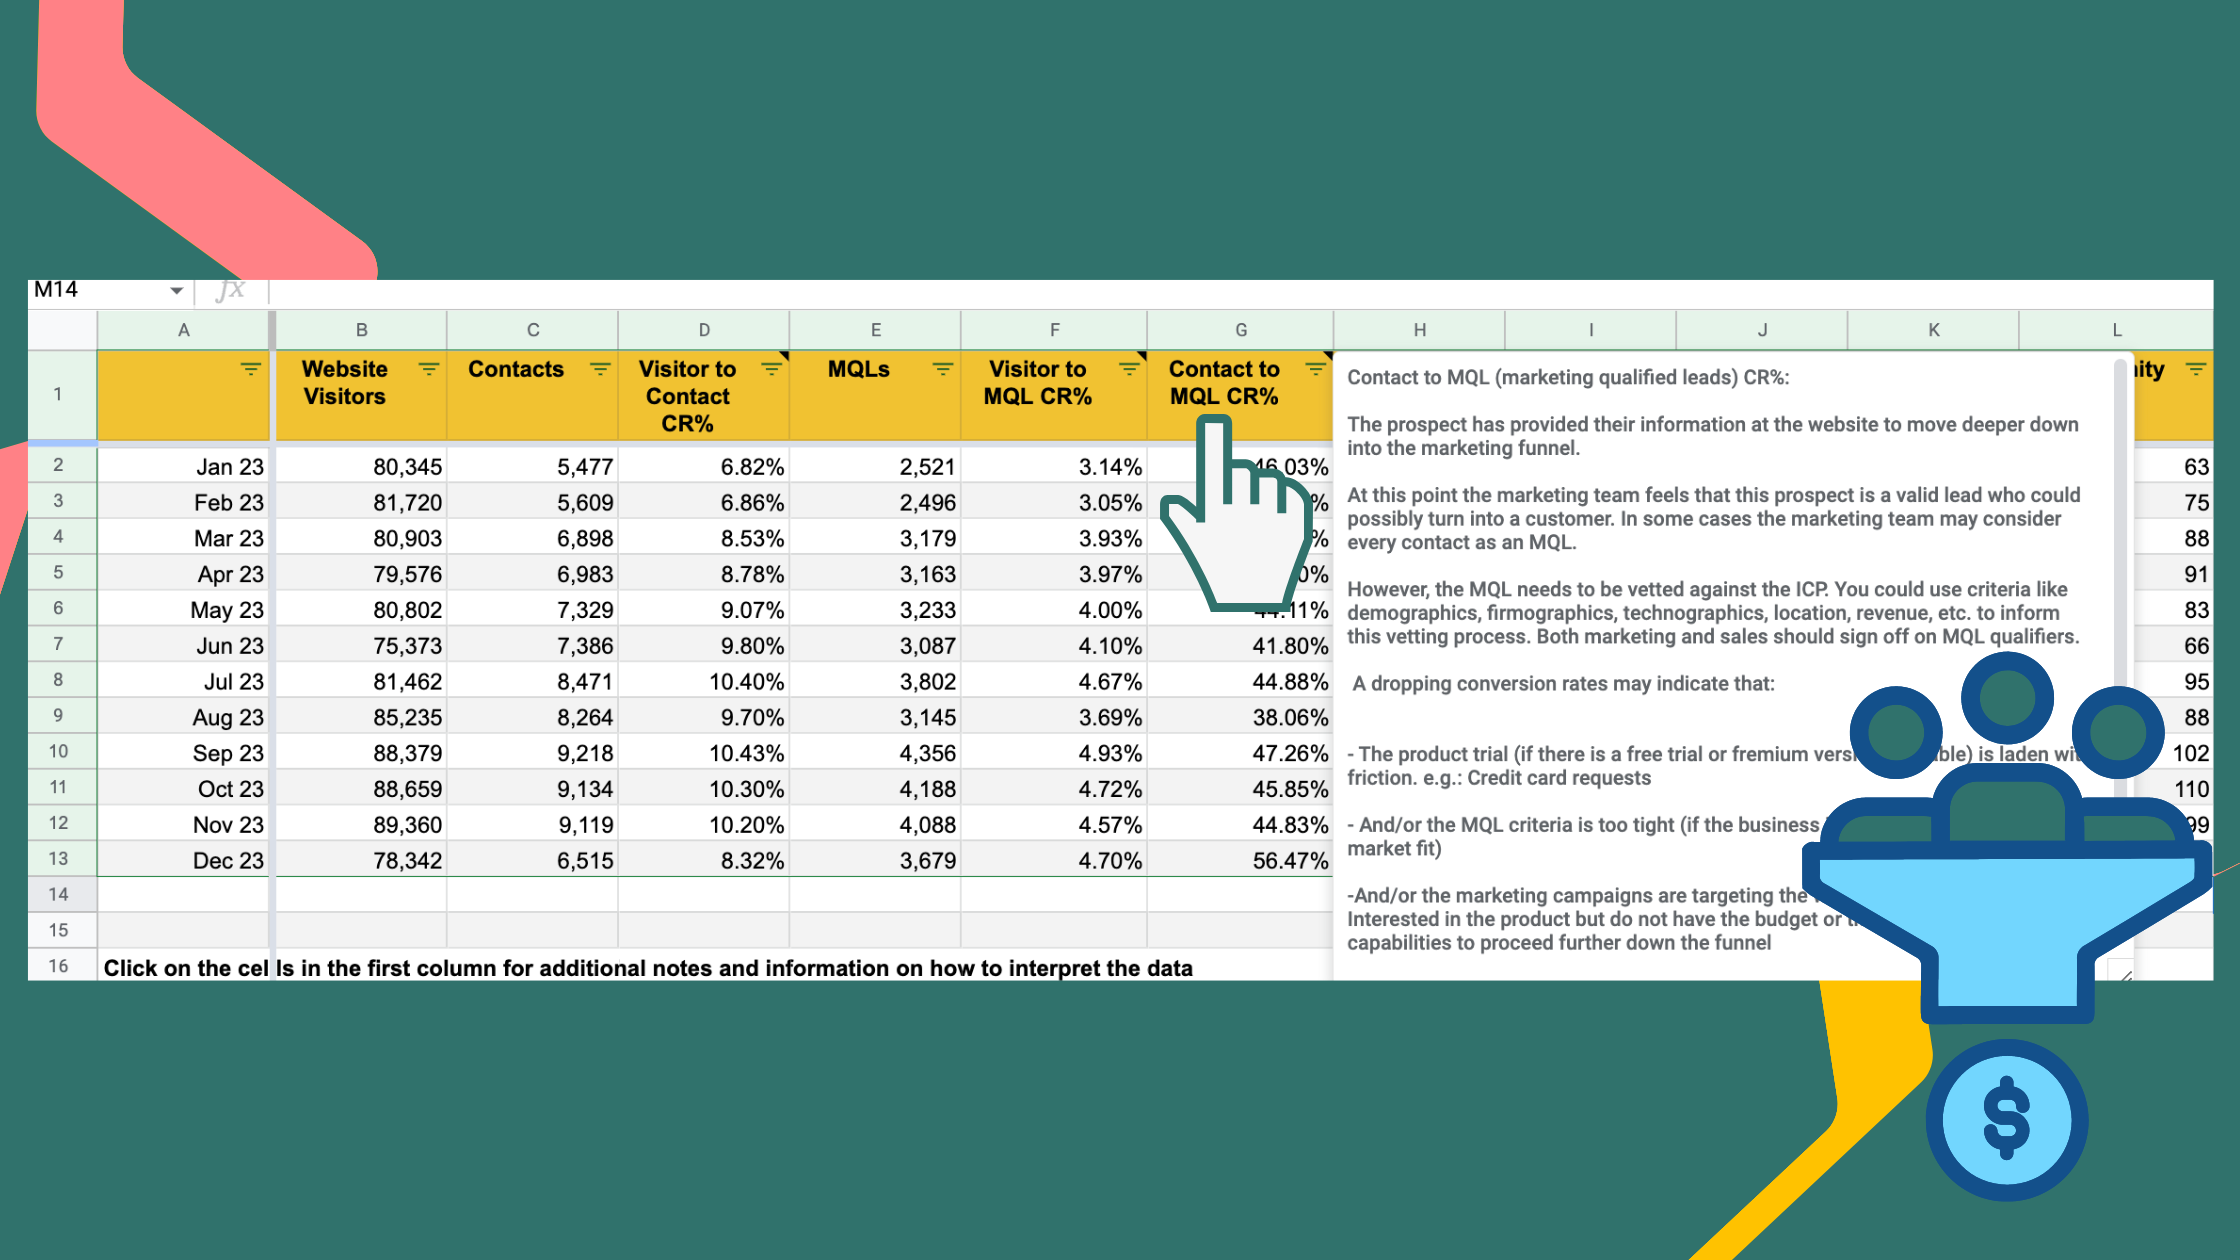
Contact to MQL (marketing qualified leads) CR%
The prospect has provided their information on the website to move deeper down into the marketing funnel.
At this point, the marketing team feels that this prospect is a valid lead who could possibly turn into a customer. In some cases, the marketing team may consider every contact as an MQL.
However, the MQL needs to be vetted against the ICP. You could use criteria like demographics, firmographics, technographics, location, revenue, etc. to inform this vetting process. Both marketing and sales should sign off on MQL qualifiers.
Dropping conversion rates may indicate that:
- The product trial (if there is a free trial or freemium version available) is laden with friction. e.g.: Credit card requests
- And/or the MQL criteria is too tight (if the business is still figuring out product-market fit)
- And/or the marketing campaigns are targeting the wrong audience e.g.: Interested in the product but do not have the budget or the self-onboarding capabilities to proceed further down the funnel
- Etc.
To see the rest of the metrics please Purchase and download the complete template here.
A Built-In GTM Improvement Model
Regular monitoring of these metrics is a great way to identify the weaknesses and strengths of the go-to-market engine and optimize towards goals.
The utility of the spreadsheet improves over time as accrued trend patterns emerge to indicate deviations from the norm. The best way to improve the performance of your funnel is by comparing it to your previous conversion rates which will allow you to steer iterative optimizations. The process allows you to progressively develop better insights into the workings of your go-to-market motions.